Truss Modeling
There is ongoing debate among engineers regarding the correct modeling approach for truss structures. This document first illustrates common methodologies currently used by engineers through an example. Subsequently, the correct methodology employed by MkaPEB is clearly presented.
CASE 1 (single continuous bottom chord):
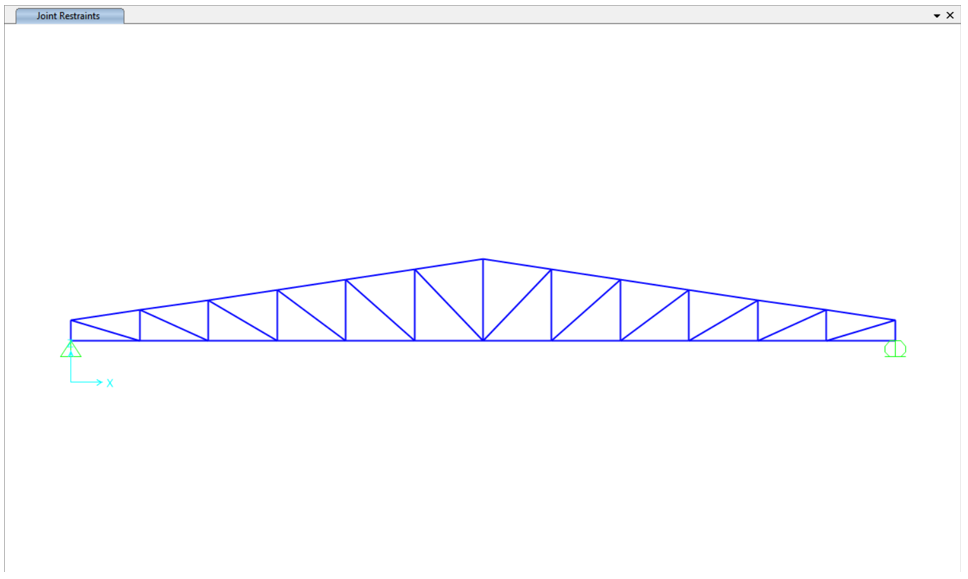
Some engineers model the bottom chords of the truss as a single continuous member, as illustrated in the figure below:
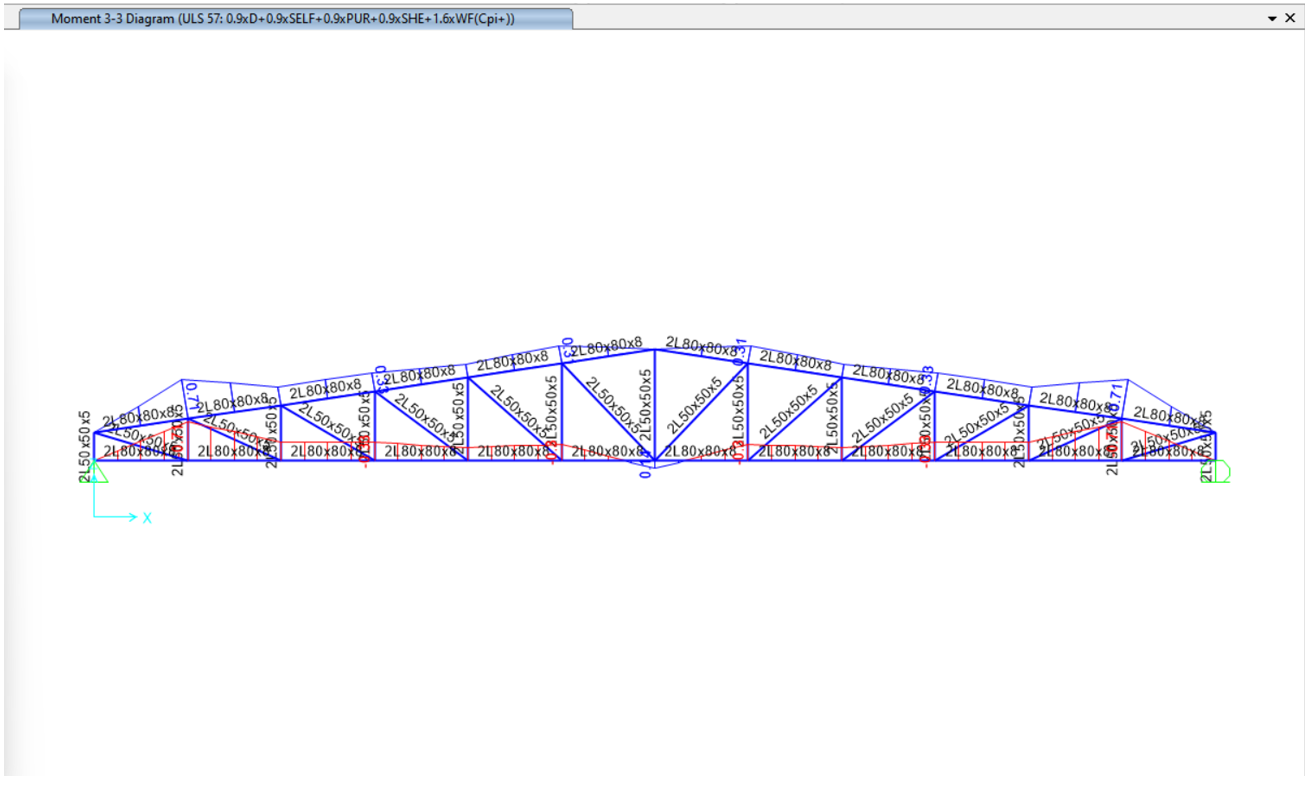
The results of the structural analysis are shown in the figure below. However, as indicated in the static analysis (shown in the figure), a “moment” appears in the structure. This contradicts the fundamental principles of truss behavior. A truss is a structural system composed of straight members carry only axial forces (tension or compression) and not bending moments. Therefore, this type of modeling is inconsistent with truss theory, yet it is still used by a few engineers.
Even aside from the contradiction with the fundamental definition of a truss, this modeling approach leads to another critical issue: the unbraced length becomes equal to the full span of the truss (20 meters in this example). As a result, satisfying the slenderness limits, Kl/r < 200 for tension members and Kl/r < 300 for compression members, would require truss members of excessively large cross-sectional size.

CASE 2 (node-to-node segmented bottom chord):
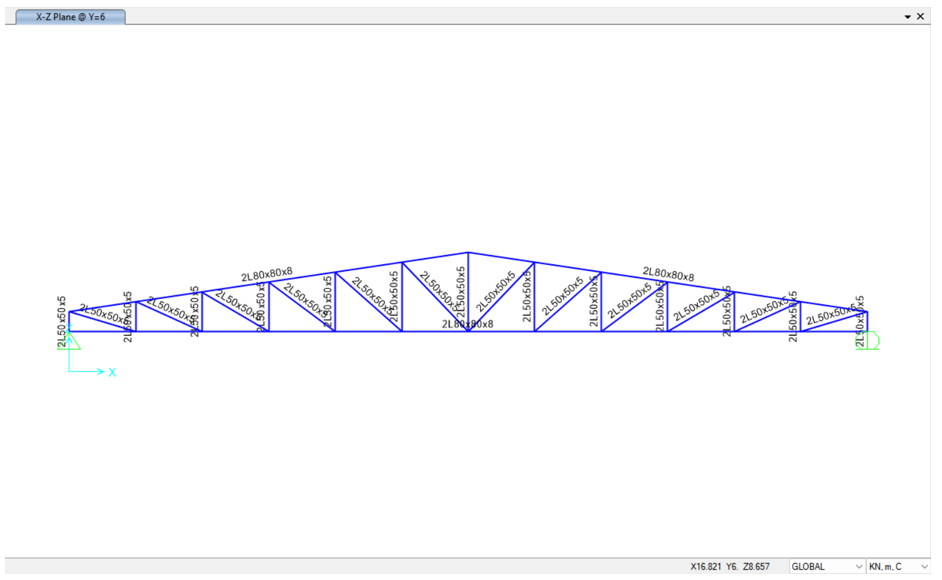
In another modeling approach, some engineers treat each segment between two nodes as an independent element, as illustrated in the figure below:
In this case, the same issue, the presence of moments, still exists. However, due to the relatively small magnitude of these moments in some cases, engineers often choose to ignore them.
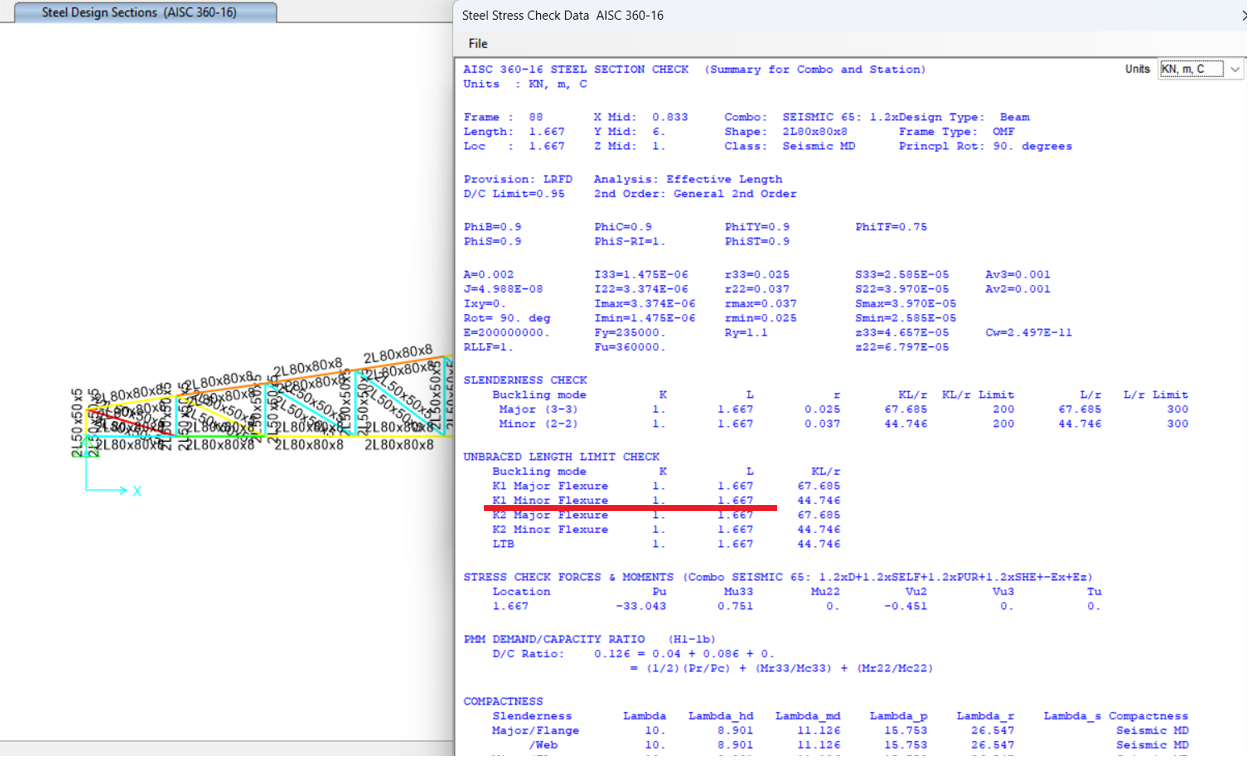
Nonetheless, a critical issue arises with this modeling method. As shown in the figure below, in this case the unbraced length ratio in minor axis, (K1 Minor) automatically is considered to be equal to 1 in SAP2000. This assumption may be valid for the top chord elements when there is connection between the truss nodes and purlins, and from the purlins to the roof sheeting. This assembly (purlins and roof sheeting) can provide sufficient lateral support to prevent top chord buckling.
However, this assumption (K=1) is not valid for the bottom chord when no system, such as fly bracing, tie beams, or cross bracing, is present to provide lateral restraint.
Due to a lack of awareness of this issue, some engineers use this modeling approach without changing the unbraced length ratio in minor axis in SAP2000, ultimately presenting these unsafe section sizes as their final design.
It is important to emphasize once again that it is entirely incorrect to assume a buckling coefficient (K) equal to 1.0 in the minor axis direction when there is no system in place to restrain the lateral buckling of the bottom chord. This oversight can lead to dangerously unconservative designs and must be avoided in any accurate truss analysis.
CASE 3 (ideal truss modeling with moment releases)
In SAP2000, it is possible to model idealized pinned connections by releasing the bending moments at the ends of an element. This is done by assigning moment releases (M22 and M33) at both the start and end of the element. By releasing these moment components, the element is allowed to rotate freely at its ends, simulating a pin connection that does not resist bending moments about the local 2-2 and 3-3 axes. This is essential for accurately modeling truss members, which are intended to carry only axial forces.
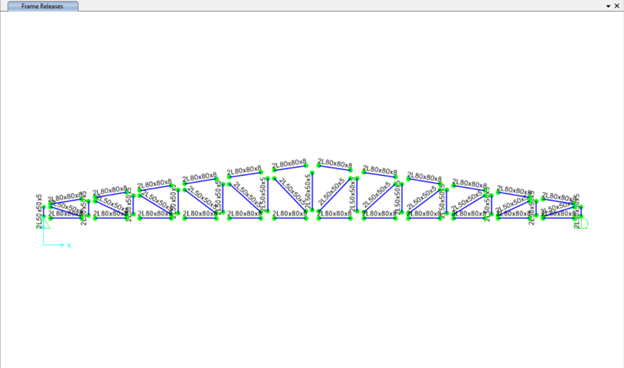
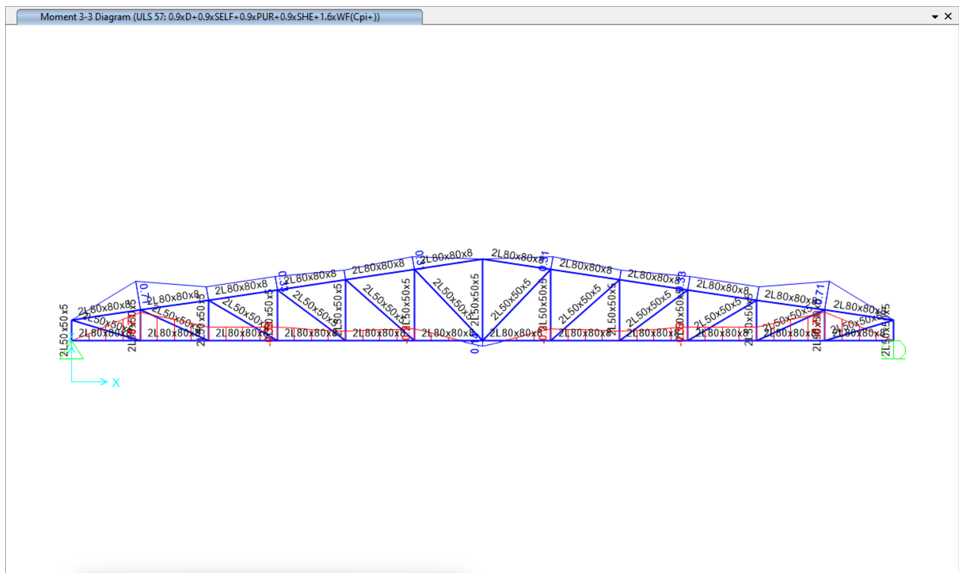
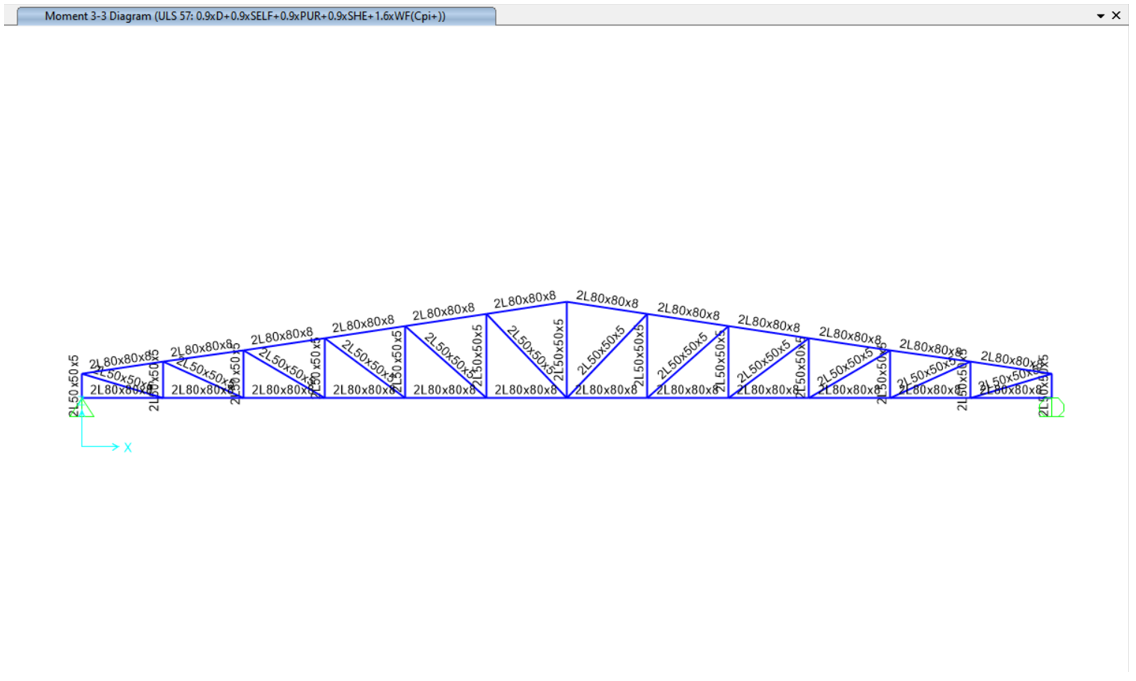
As shown in the figure below, after releasing the end moments (M22 and M33), the structure no longer develops bending moments, confirming that the system now behaves as an ideal truss.
However, the same critical issue remains: the unbraced length ratio, minor direction, (K) in the minor direction of bottom chord is still equal to 1.0.
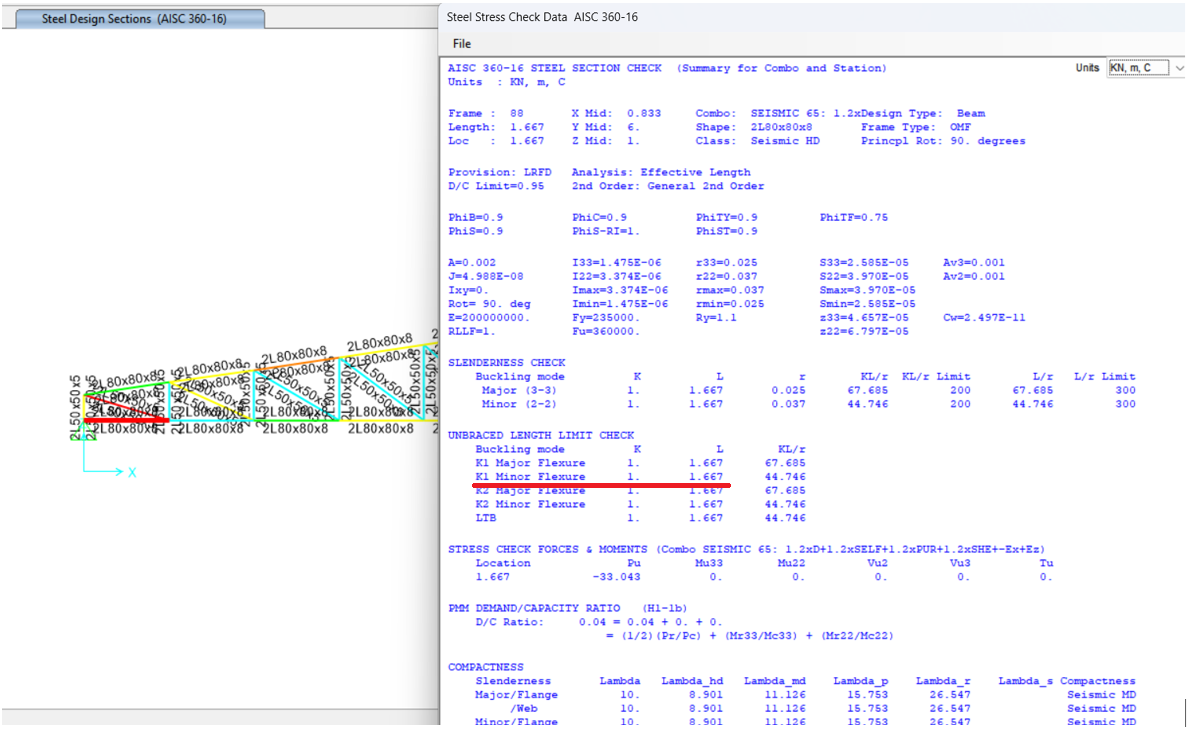
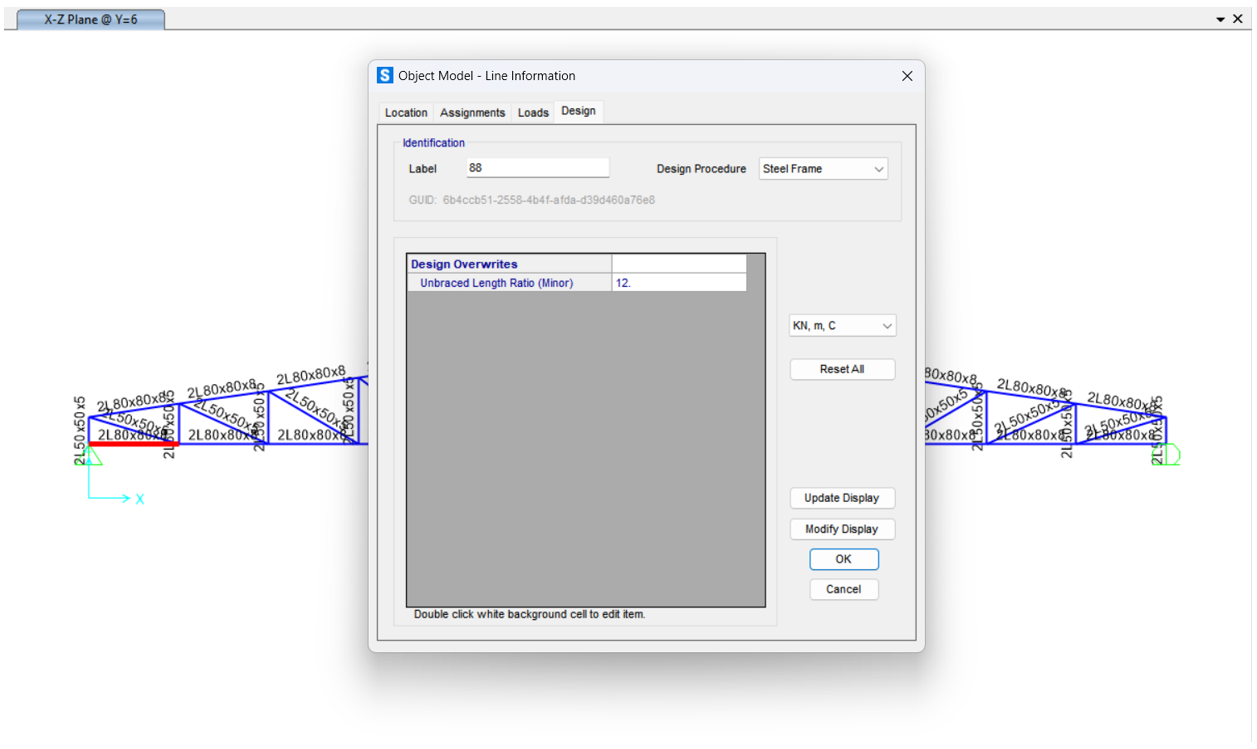
In the absence of any bracing to prevent buckling in the bottom chord, the unbraced length in the minor direction for each bottom chord element should be set equal to the full length of the bottom chord. In this example, since there are 12 elements and no intermediate bracing, the unbraced length ratio should be set to 12.
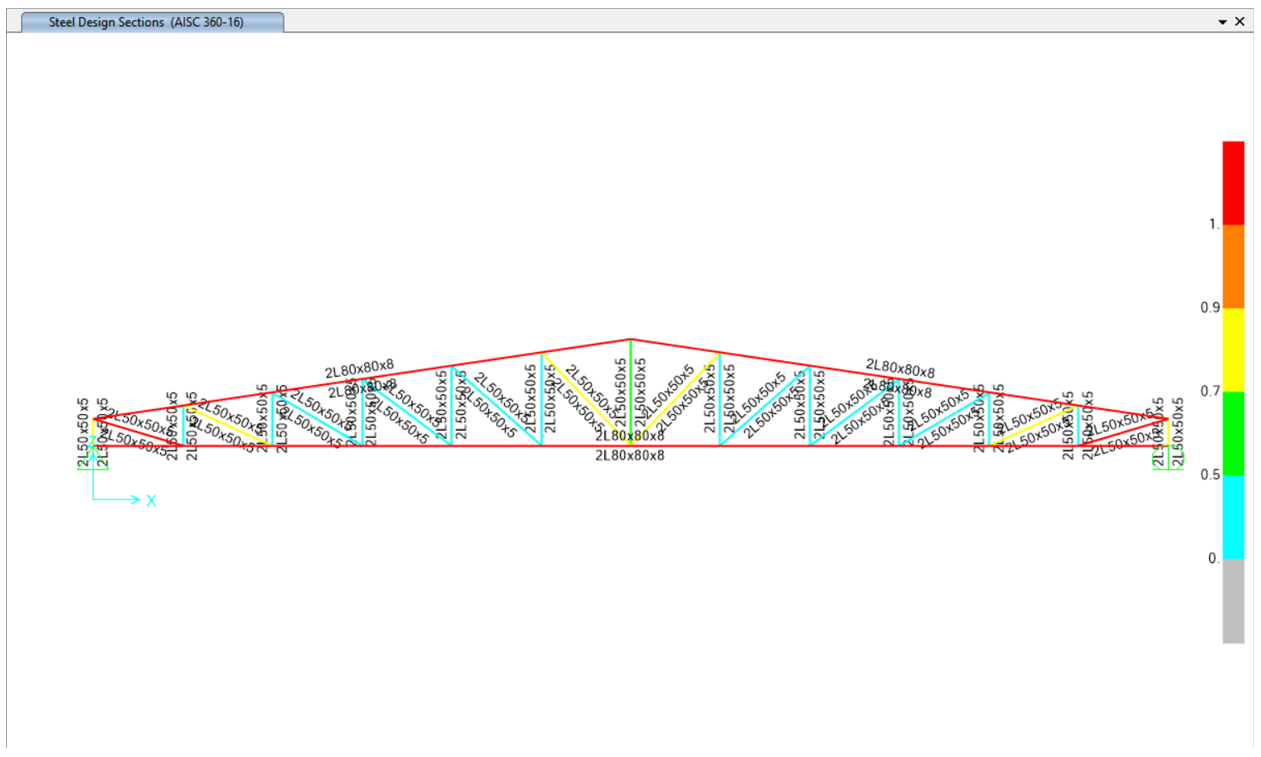
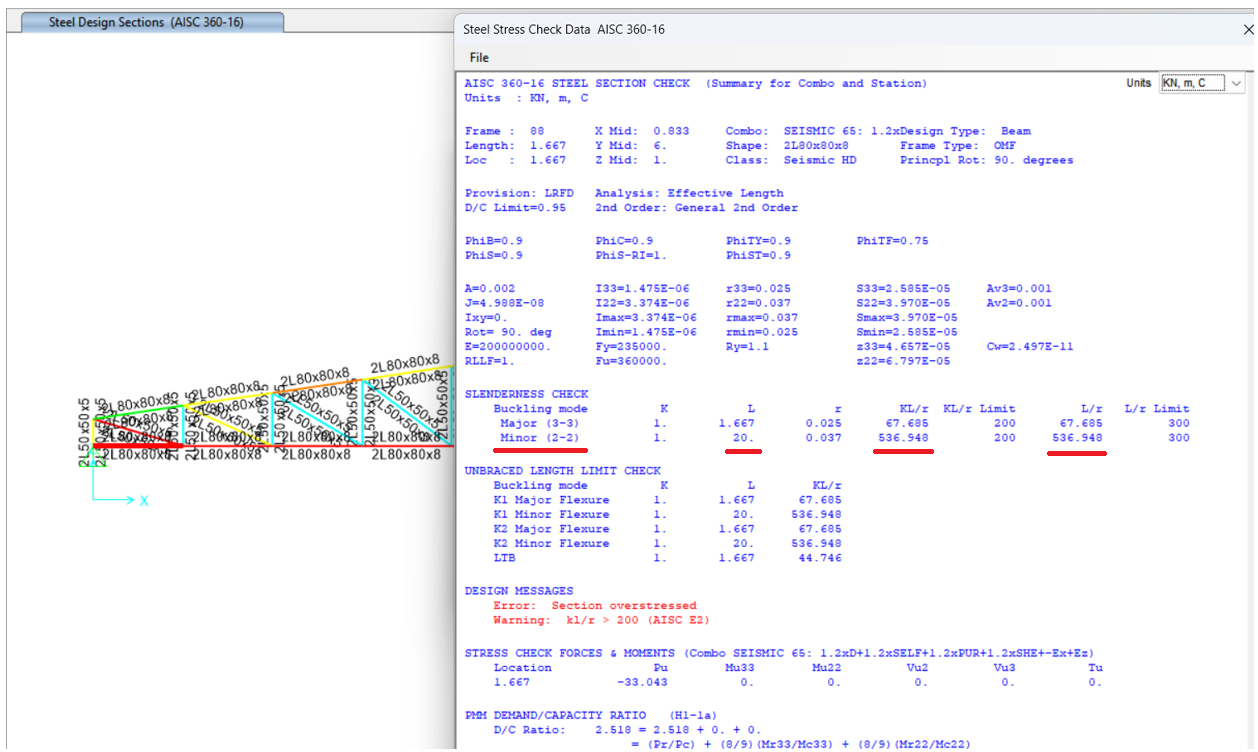
In this case, as shown in the figure below, the section fails to satisfy the unbraced length limit check at a 20-meter unbraced length.
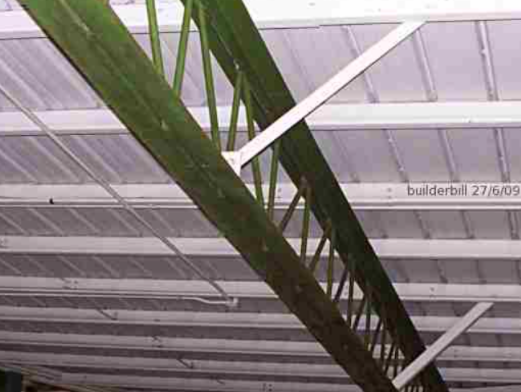
Stabilizing the Bottom Chord: Flange Bracing
As shown in figure below, flange bracing members are installed diagonally from the bottom chord to the roof framing system. These braces provide lateral restraint to the bottom chord, effectively reducing its unbraced length in the minor axis direction and preventing lateral-torsional buckling under compression. This type of bracing is essential when the bottom chord is subjected to compressive forces.
CASE 4 (ideal truss modeling with moment releases and midspan flange bracing):
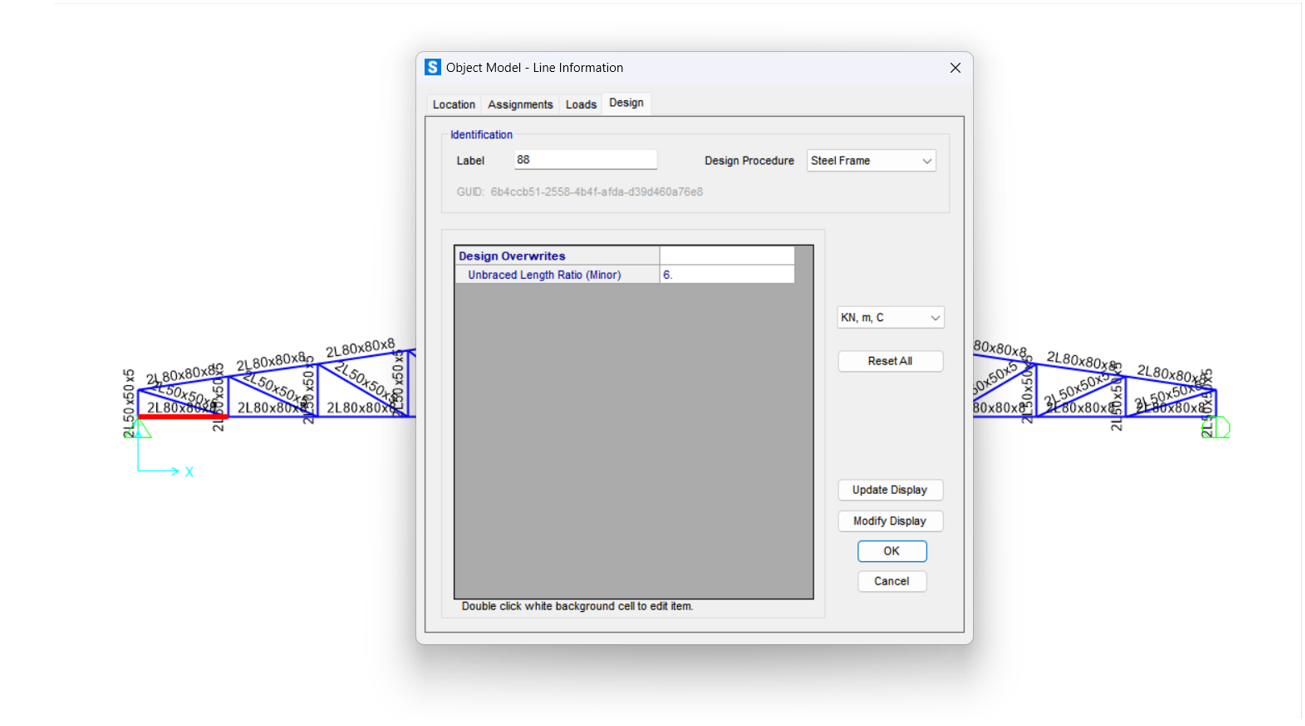
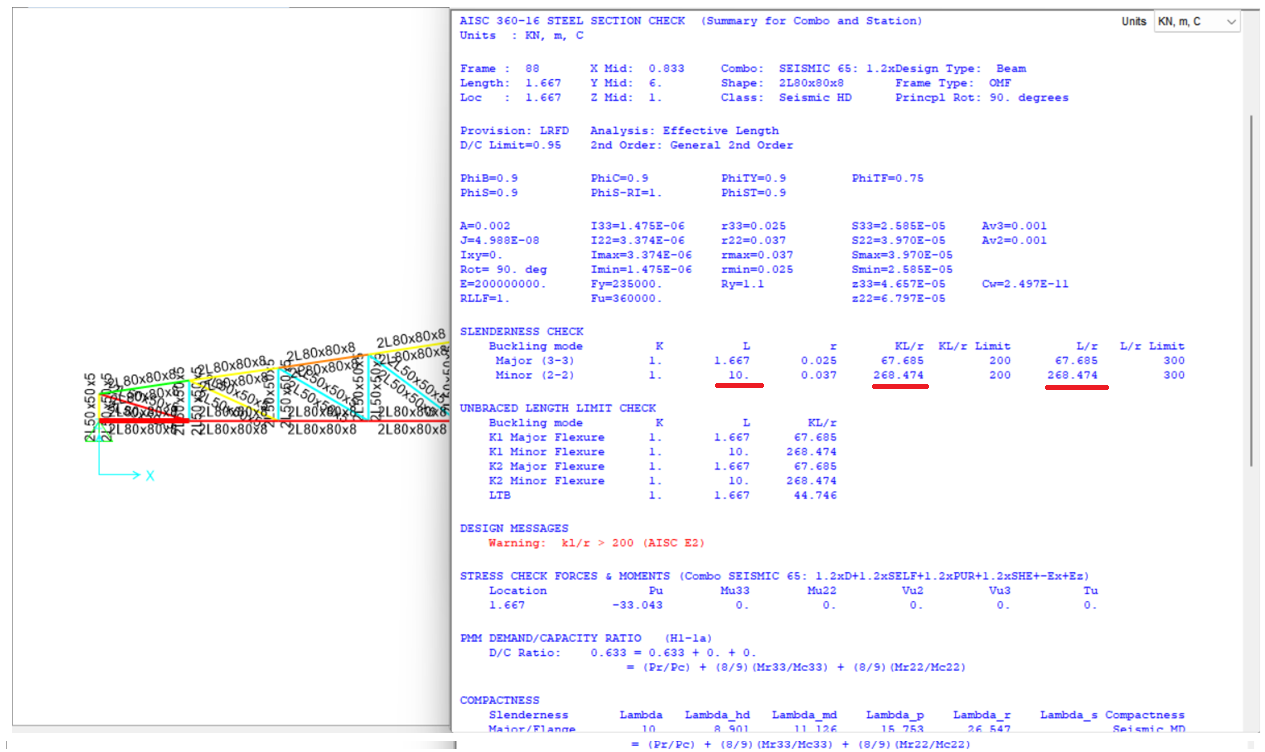
Here, it is assumed that there is a bracing installed in the bottom chord of the truss at midspan. Therefore, the minor-axis unbraced length ratio is set to 6, corresponding to half the number of bottom chord elements (bottom chord element numbers/ 2).
However, as shown in the figure below, it still does not satisfy the unbraced length limit check in this case.
CASE 5 (ideal truss modeling with moment releases and flange bracing every two elements):
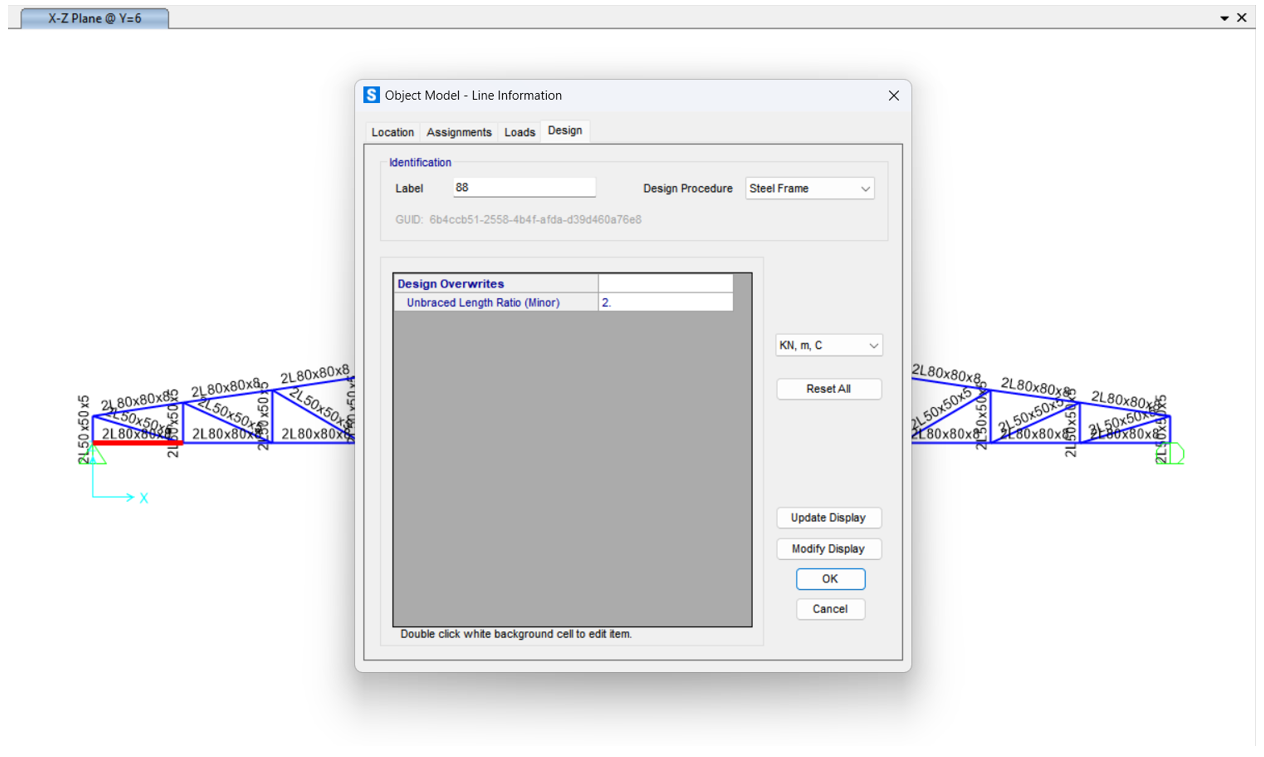
In this case it is assumed that a bracing system (flange bracing) is installed at every two bottom chord elements. As a result, the unbraced length in the minor direction for each bottom chord element is set equal to the length of two elements, i.e., the unbraced length ratio is set to 2.
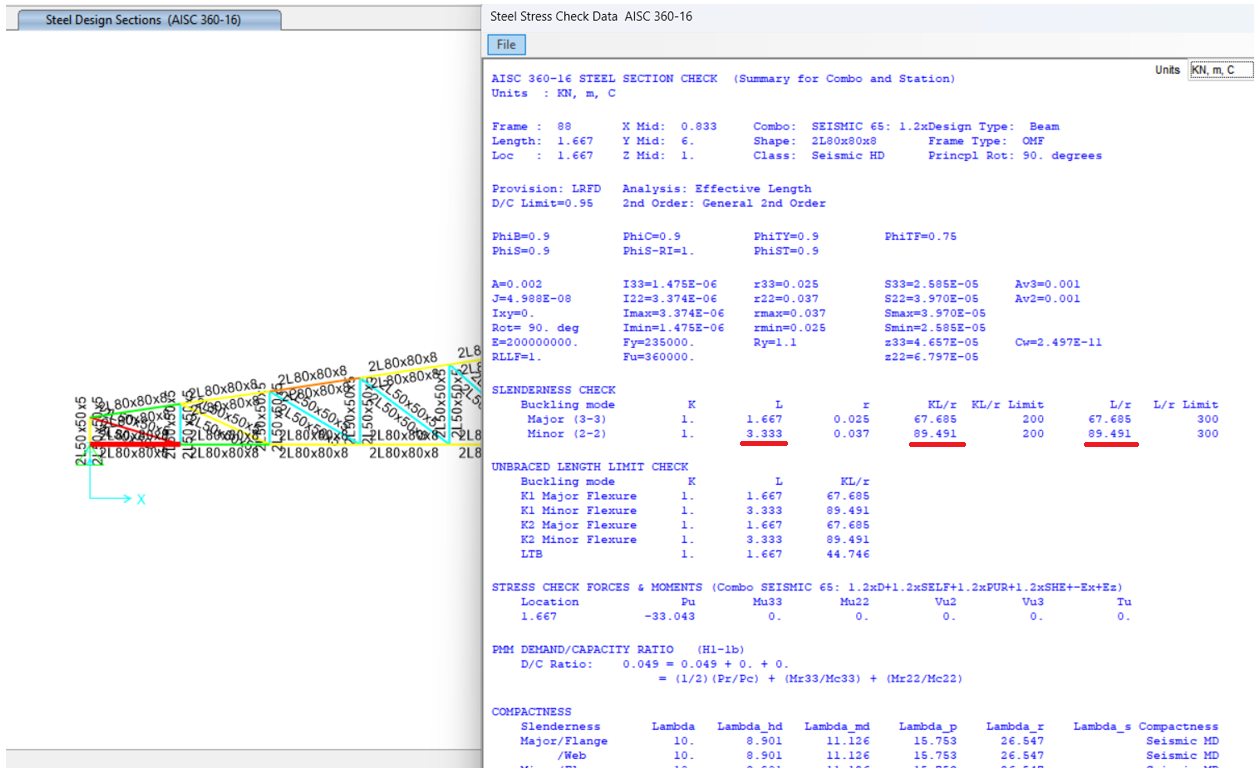
As shown below, by assuming the presence of flange bracing at every two bottom chord elements (i.e., spaced at 3.333-meter intervals), the unbraced length requirement in the minor direction is satisfied.
RESULTS COMPARISON BETWEEN SAP2000 AND MkaPEB
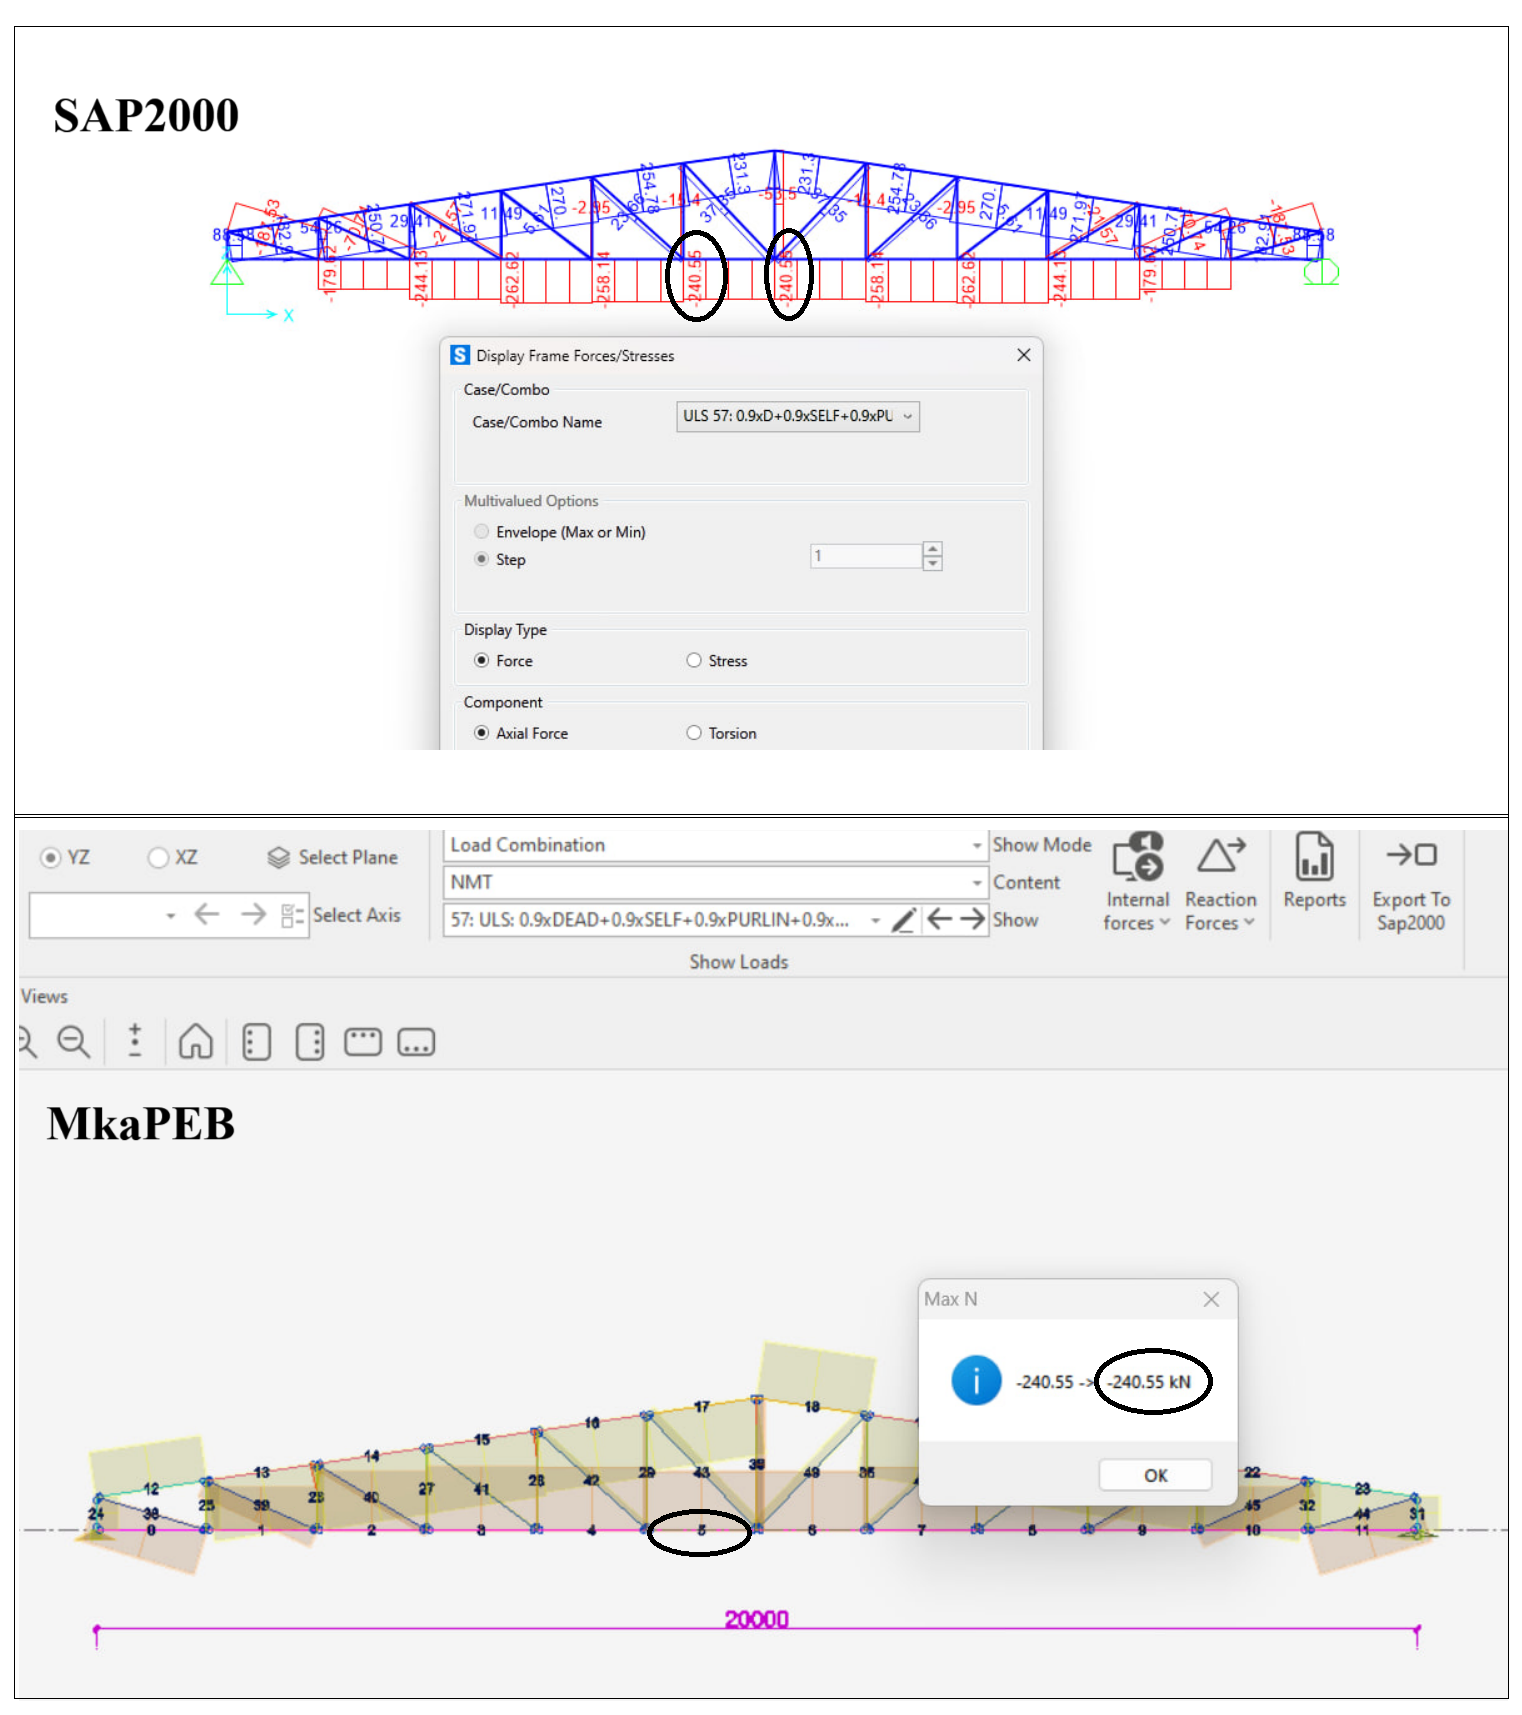
The analysis results of the model have been extracted from both SAP2000 and MkaPEB. The internal axial forces in the same load combination is calculated by each software are shown in the figure below. As illustrated, the axial force in the highlighted element is identical in both software outputs.
Next, the design check was performed in SAP2000. For the selected element and the specified load combination, SAP2000 calculated a design ratio of 0.719 based on AISC 360-16. The corresponding ratio obtained from MkaPEB for the same element and load combination is 0.685.
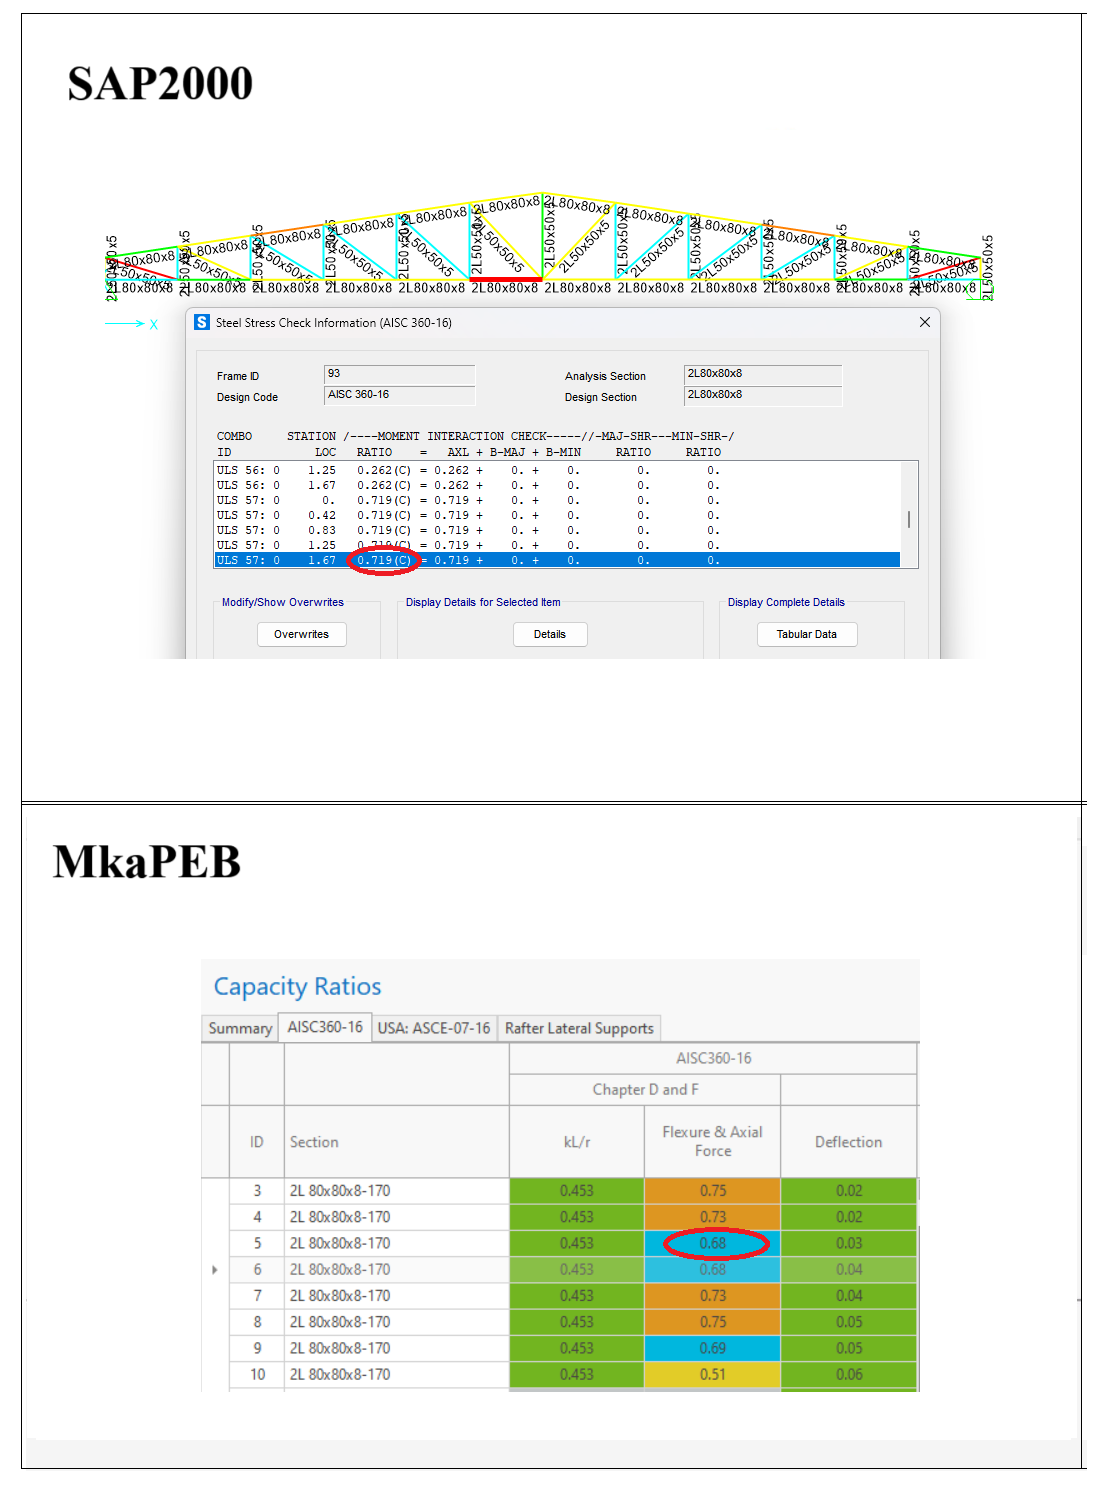
The source of the approximately 4% difference between the two results is explained in the following section.
One of the main reason of the difference is, the difference in the section shapes defined in SAP2000 than MkaPEB.
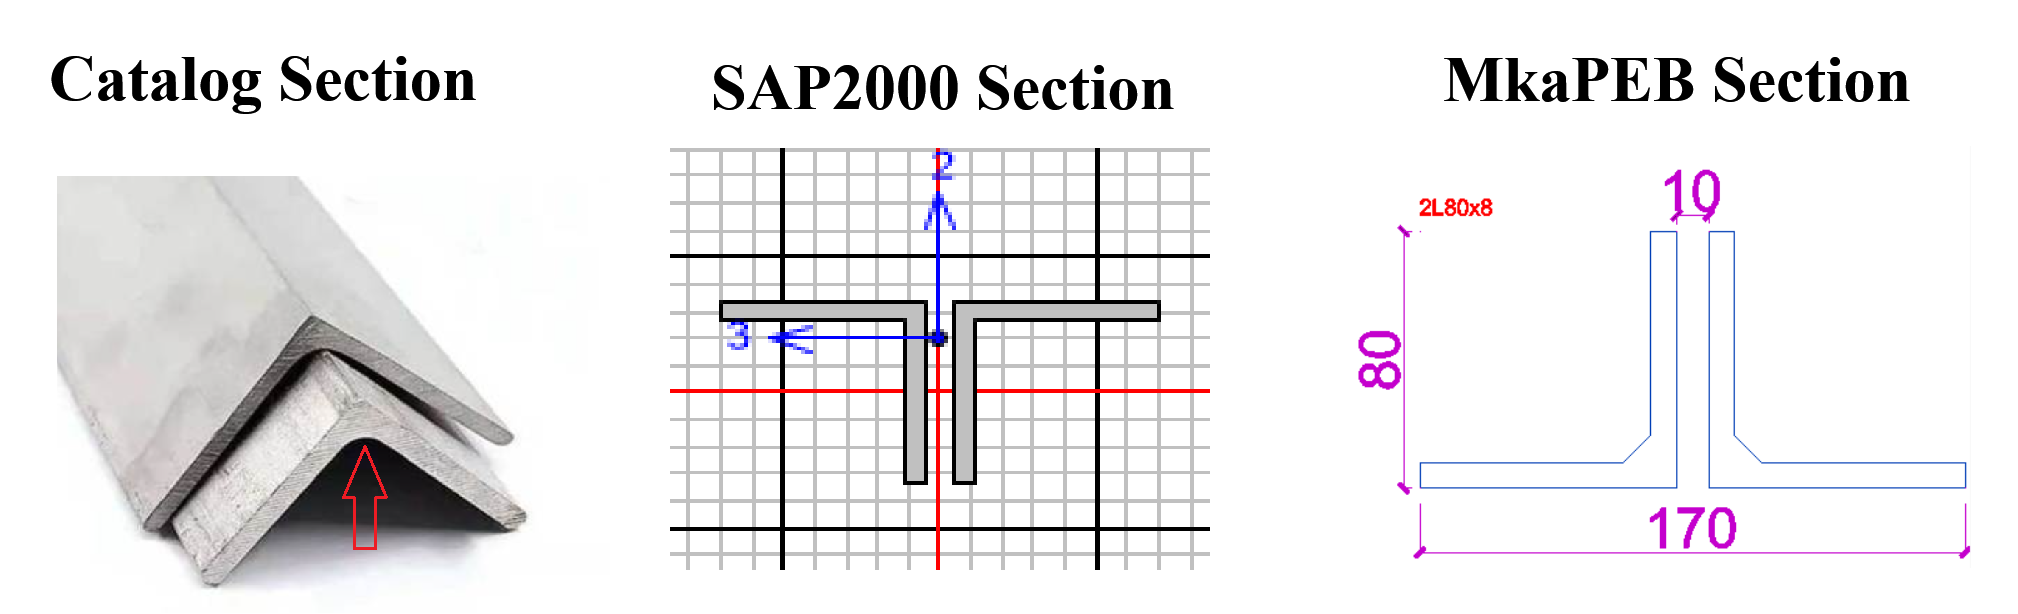
As shown in the figure above, the fillet region is ignored by SAP2000, which results in the difference in the section area, and other properties as shown below:
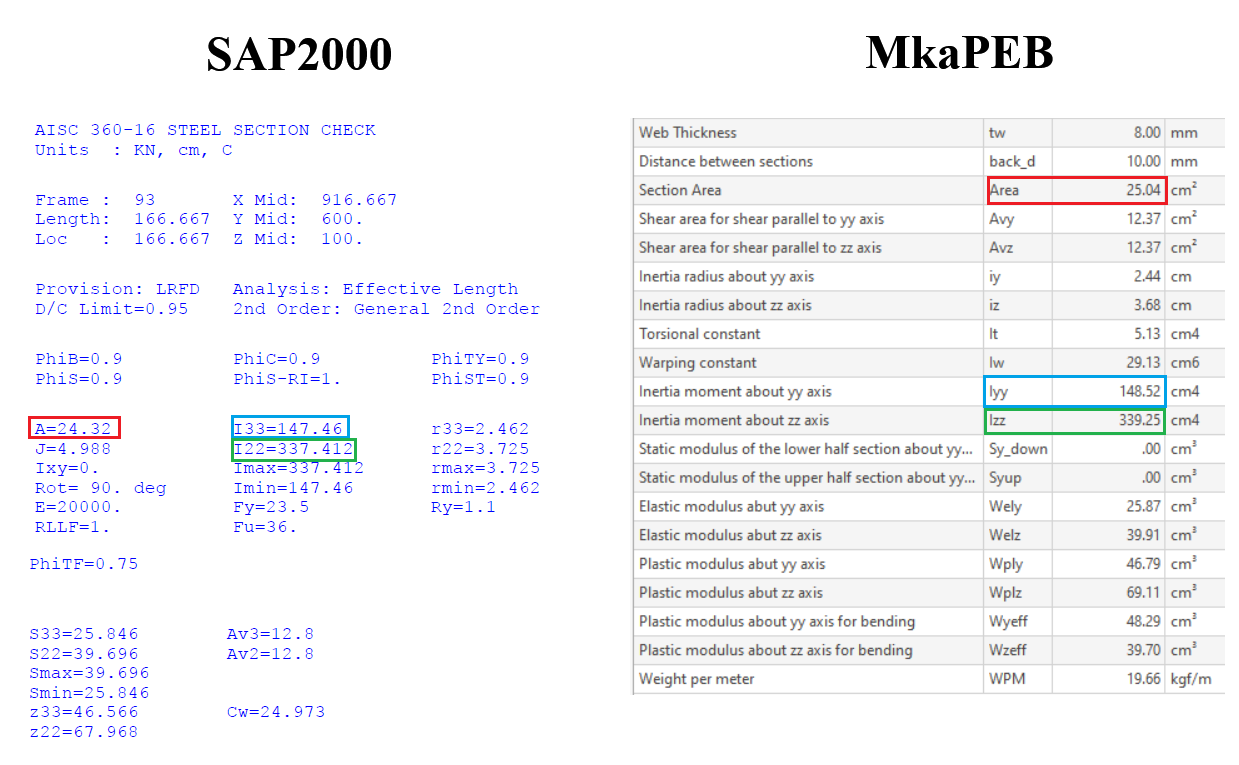
Moreover, the two legs are connected to each other by plates at regular intervals, which increase the overall structural strength of the element. MkaPEB is capable of accounting for this factor in its design checks, whereas SAP2000 does not consider it. This difference contributes to the approximately 4% discrepancy in the design ratio result.
Created with the Personal Edition of HelpNDoc: Eliminate the Struggles of Documentation with a Help Authoring Tool